GOAL
When there're abnormal request latencies, one of the possible causes is packet loss, as it leads to reconnections. ICMP is not always enabled along the hops. mtr combines the functionality of the traceroute and ping programs in a single network diagnostic tool. It can test connectivity on any TCP port.
This knowledge article explains how to use mtr to diagnose the latency issue potentially caused by packet loss.
PROCEDURE
- Install the mtr tool. Run "yum install mtr" or "apt-get install mtr-tiny" on Linux host. Use WinMTR on Windows
- Run "mtr -P <tcp port> -T <destination ip>" or "sudo mtr -P <tcp port> -T <destination ip>" in Linux to do a live test
- Run "mtr -P <tcp port> -T -w <destination ip>" or "sudo mtr -P <tcp port> -T -w <destination ip>" in Linux to generate a report. It sends 10 packets to the host by default, use "-c <packet number>" for more packets
The
Loss% column shows the percentage of packet loss at each hop. The
Snt column counts the number of packets sent.
The next four columns
Last,
Avg,
Best, and
Wrst are all measurements of latency in milliseconds (e.g. ms).
Last is the latency of the last packet sent,
Avg is the average latency of all packets, while
Best and
Wrst display the best (shortest) and worst (longest) round trip time for a packet to this host. In most cases, the average (
Avg) column should be the focus of your attention.
The final column,
StDev, provides the standard deviation of the latencies to each host. The higher the standard deviation, the greater the difference is between measurements of latency.
When analyzing MTR output, you are looking for two things: loss and latency. Take a real test result (mtr -P 80 -T -w <ip>) for an example.
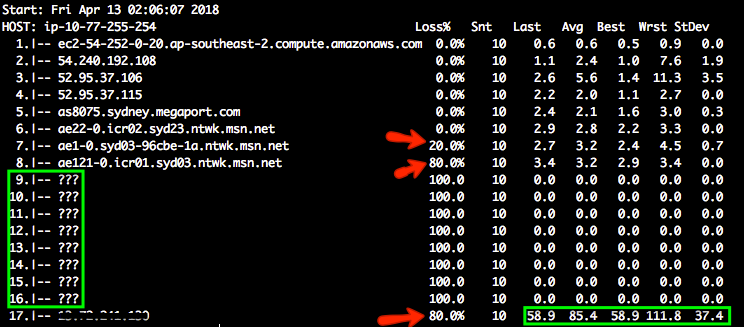
The question marks appear when there is no additional route information. There's not much information we can get from the hop 9 to hop 16. When different amounts of loss are reported, always trust the reports from later hops.
There is 20% packet loss from hop 6 to hop 7 and 80% from hop 7 to hop 8. The destination also has 80% packet loss. The customer reported significant latency up to 13 seconds in performance testings. It seems to be something with hop 6, 7 and 8. Please note some of the loss is due to rate limiting. If there's no packet loss on the destination, it means the connectivity is good.
The latency is 85.4 ms on average. Hop 8 to 16 introduced 100ms delay or so.
A sample approach to run mtr periodically1. Create a shell script with desired mtr command. This example is to run mtr to port 443, 55 packets in 60 sec interval, output the result to /tmp/mtr.log.
$ cat getmtr.sh
#!/bin/sh
while true; do mtr -P 443 -T <TargetHost> -c 55 -r -n >> /tmp/mtr.log; sleep 60; done;
2. Then chmod 775 to let the script be executable
$ chmod 775 getmtr.sh
3. Run the script as a background job
$ ./getmtr.sh &
4. Once you have captured mtr for the desired period, make sure to stop the background job
$ ps -ef | grep mtr
$ kill <pid for the job>
5. Now you will see the mtr result which was taken every 60 sec in the logfile(in this case it is in /tmp/mtr.log)
Another command to generate a quick MTR report with TCP as the option:
mtr -P 443 -T <IP or FQDN> -r -n
Reference
You will find the detail for the mtr command, how to read the mtr result.
https://linode.com/docs/networking/diagnostics/diagnosing-network-issues-with-mtr