Please note: This article details the use of a specific part of the Information Collector Tool. For installation and initial setup guidelines please refer to the
Support information collector article.
Usage of Profile command
This command allows you to start the profiling of a running Mule Runtime or rebuild a report from a previous profile.
The usage is: support-collector profile [flags] and the flags are:
Flags:
      --compress          Compress the information collected. (default true)
      --config string     Path to an explicit configuration file.
      --count int         Set the number of thread dumps to capture before stopping capture. Default is 0 that waits for Ctrl-C to stop capture.
  -h, --help              help for profile
      --interval int      Determine how often the thread dumps are captured (in seconds). (default 5)
      --jdkhome string    Use this path to JDK installation instead of detecting it automatically.
      --mulehome string   Use this path to replace auto detected MULE_HOME.
      --no-apps           Exclude the attachment of apps folder in the resulting zip.
      --no-logs           Exclude the attachment of logs folder in the resulting zip.
      --no-report         Exclude the construction of the PDF report.
      --path string       Path to a folder with the profile information. If this parameter is set, then a new report will be build with the profile information.
  -p, --pid int32         Running Mule runtime process id.
      --split string      Split the output zip file in chunk of the selected size. (default "500MB")
  -w, --workdir string    Working base directory. Where the collector information will be stored. (default ".")
Starting a new profiling
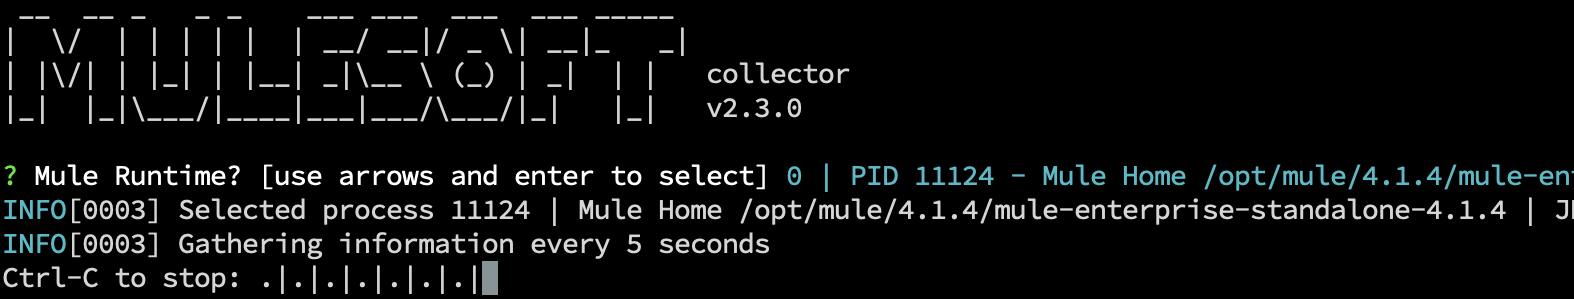
- Select the running runtime. You can use the "pids" command to get the process id and use the flag --pid to specify the process to profile. Optionally, if you avoid this flag, you'll be asked on the console.
- The profiling will start right away. You'll see an indication of dots and bars showing the progress. This process will continue until ctrl-C is pressed.
- Execute the tests you have to reproduce the high CPU consumption.
- When the tests finish, stop the profiling with keys ctrl-C (or with the --count parameter to limit the number of snapshots). CPU information gathering will stop and the rest of the information will be collected, the PDF report rendered, and a bundle ZIP with all the information.
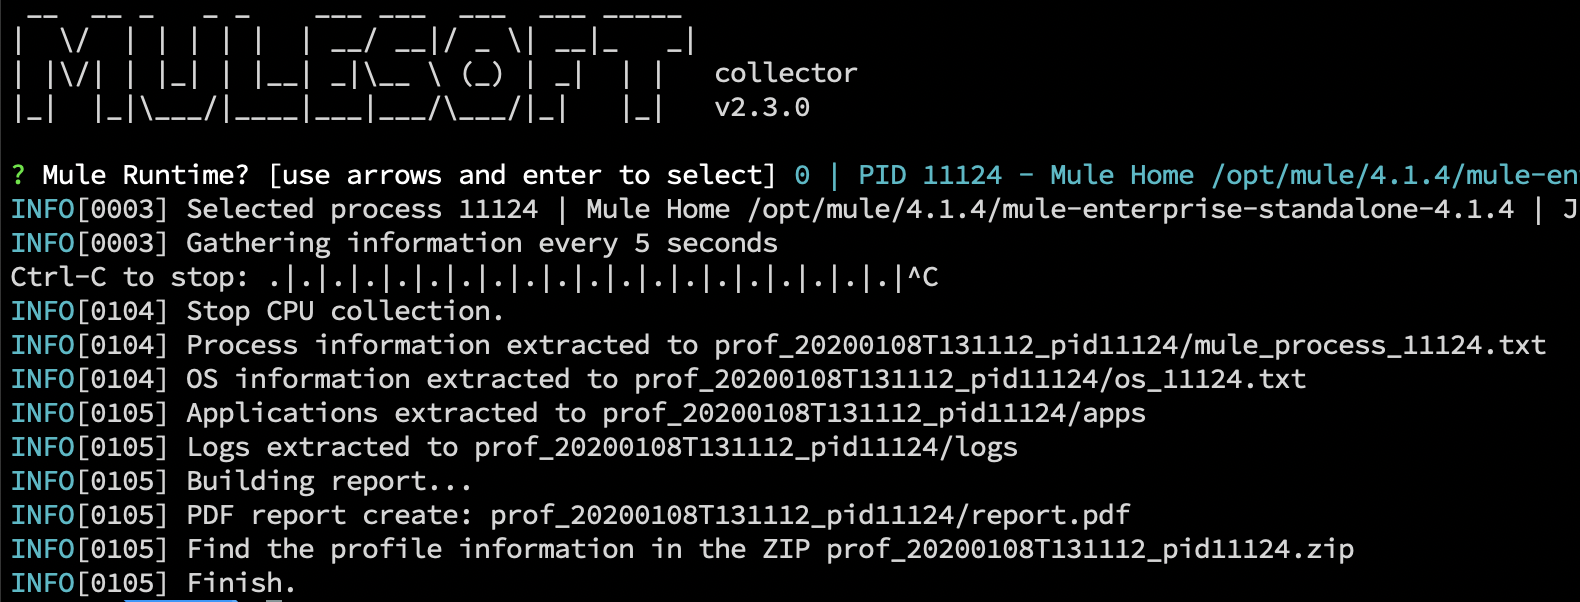
- Check the zip file generated. Inside you'll find a PDF report with:
- Total CPU consumption over time
- CPU consumption per application over time
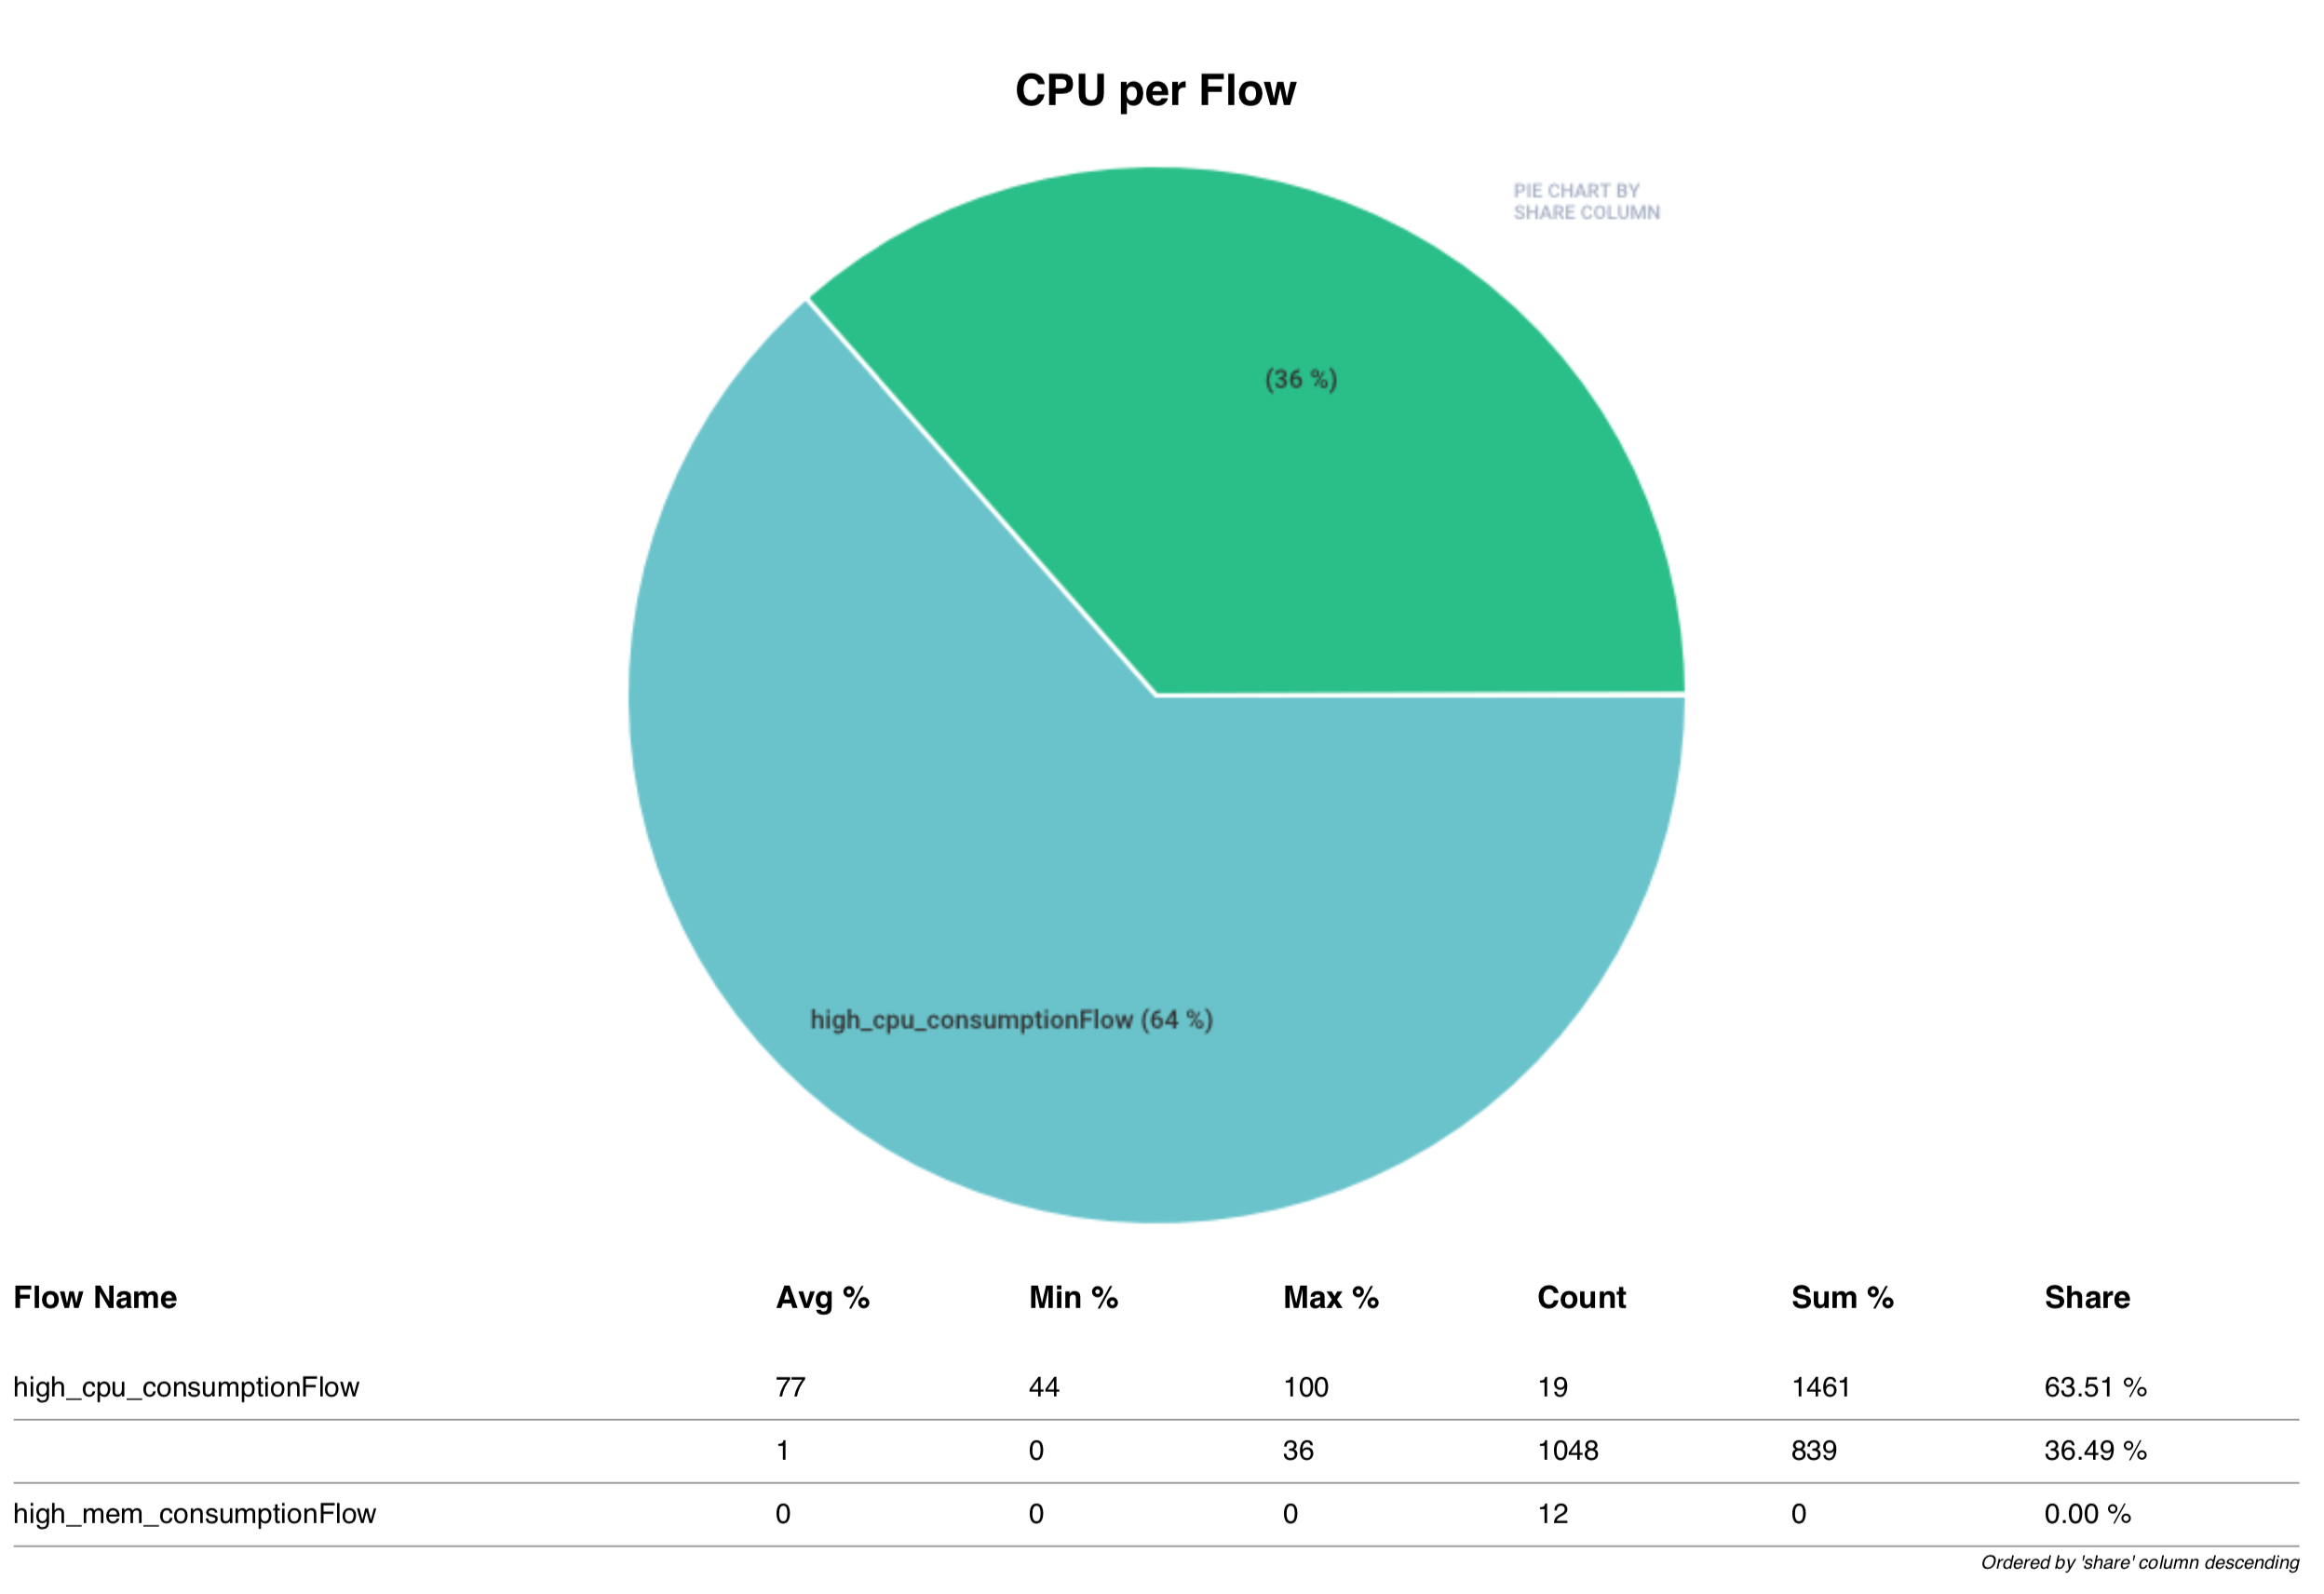
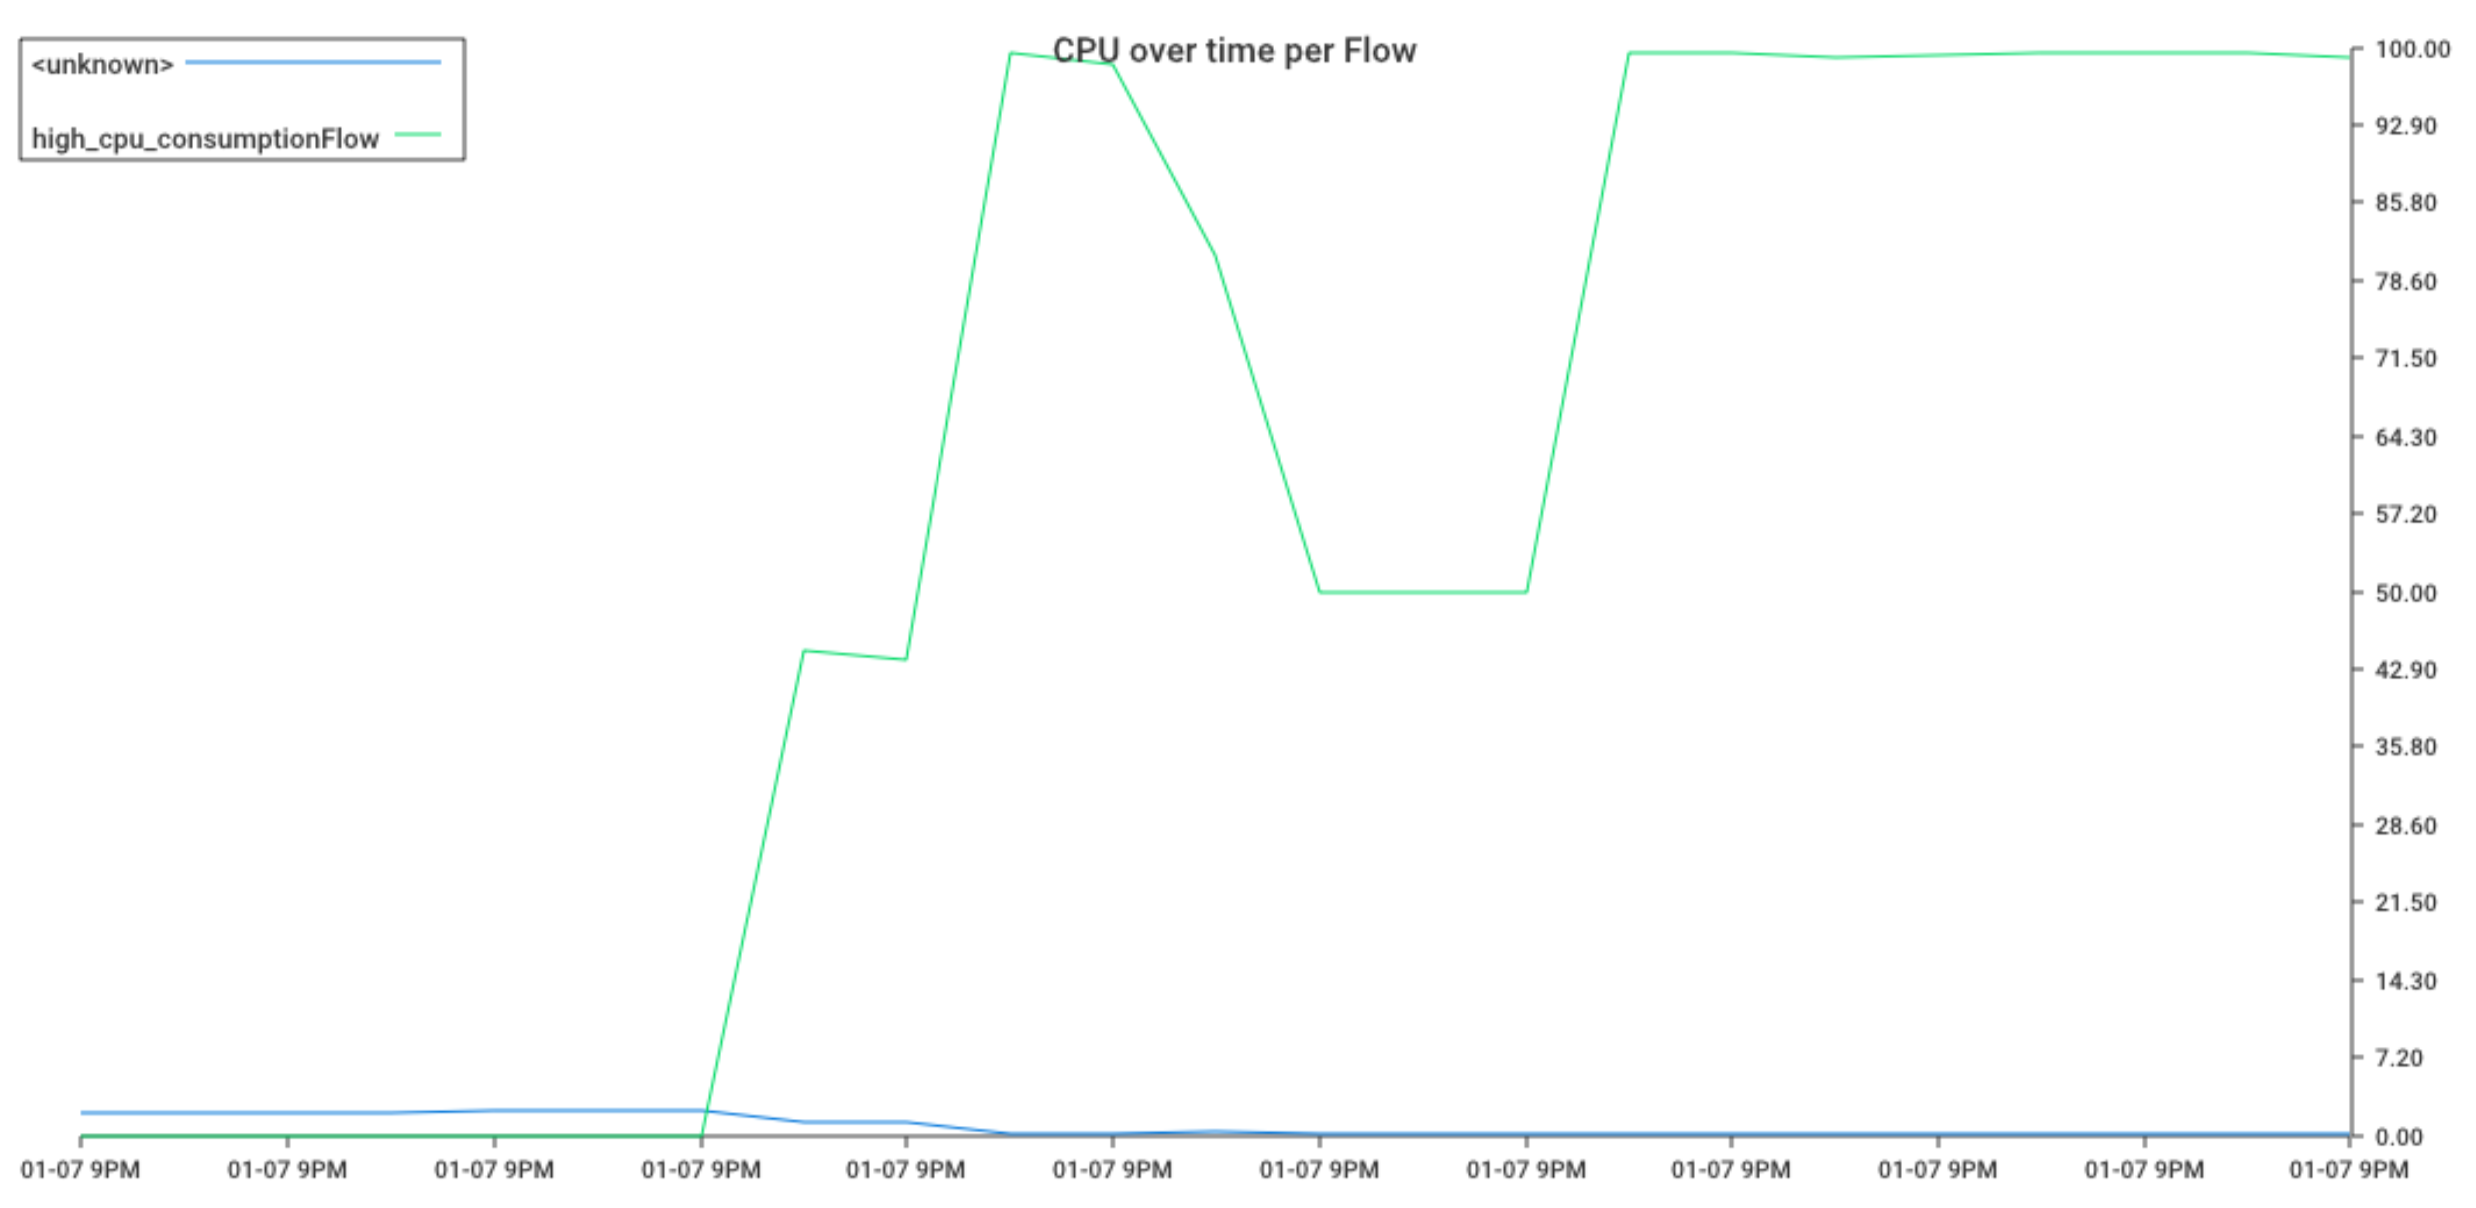
- CPU consumption per-flow over time
- CPU consumption per thread pool over time
- Blocked threads and which thread is blocking them.
- CPU consumption per thread stack.
What's collected?
The collection process consists of taking thread dumps every 5 seconds (it's the default value, can be tuned with the --interval parameter) together with the CPU consumption for each thread.
It's also collected the logs, applications, and OS details for further analysis in case you need to check the current development and configuration of the application.
This is an automation of the process described in the article https://help.mulesoft.com/s/article/How-to-identify-top-CPU-consuming-threads
Profile configuration file
When the profiling runs, as part of the output files you will find the config.json file with the parameters used to execute the profiling.
You can use this file to repeat the same profile in the future using the flag --config. It will take the parameters from the file and execute a new one.
The sections of the configuration file are:
- interval_sec: Interval (in seconds) to take every snapshot.
- count: Set the number of thread dumps to capture before stopping capture.
- motionless_analysis:
- minimum_count: minimum of consecutive snapshots to analyze for motionless threads
- conditions:
- regex: the regular expression to be found in all the stack trace. ie: (?:mule|qpid|jms)
- title: nice descriptive title to show in the PDF report
- min_duration_secs: time in seconds that the same thread with the same stack matches with the condition. -1 value is used to skip that stack from the analysis because it's a well-known stalled thread
Motionless analysis
This analysis objective is to detect threads that are stalled in the same stack for a determined time, which may indicate a performance problem.
The result of this analysis is the file Motionless Threads analysis (10_motion_less_analysis.pdf) containing the thread name and stack where the thread was stalled and the time in that stack. If possible it will also show the application and flow for the thread.
This is a sample report for a motionless thread:
PROBLEM #1 - Service Bus connector issue #2

PID 24523 stalled from 2020-02-06 16:16:49 to 2020-02-06 16:17:01 - 12s

thread name: [MuleRuntime].io.12504: [echelon-exp-api-load].io@org.mule.runtime.module.extension.internal.runtime.source.ExtensionMessageSource.lambda$null$9:329 @2ab22d73
app: echelon-exp-api-load - flow: io@org.mule.runtime.module.extension.internal.runtime.source.ExtensionMessageSource.lambda$null$9:329

at java.lang.Object.wait(Native Method)
- waiting on <0x00000000f742bcb8> (a org.apache.qpid.jms.provider.ConservativeProviderFuture)
at java.lang.Object.wait(Object.java:502)
at org.apache.qpid.jms.provider.ConservativeProviderFuture.sync(ConservativeProviderFuture.java:117)
- locked <0x00000000f742bcb8> (a org.apache.qpid.jms.provider.ConservativeProviderFuture)
at org.apache.qpid.jms.JmsConnection.createResource(JmsConnection.java:692)
...
FAQ
Why is the total CPU usage for the process is greater than 100%?
This is related to multi-core systems and how the OS reports CPU consumption.
Another possible side effect is that the sum of %CPU consumption per thread and the %CPU for the process is different. As a general rule, %CPU consumption per thread tends to summarize lower than 100%. Take it as a proportion of the %CPU of the process.
Why do I get "can't get CPU by thread, error cant get jstack without java jdk home" ?
It's possible that your JDK installation is not in the expected path (JAVA_HOME environment variable or the JRE path that is running the mule process)
To make sure use the flag --jdkhome with the correct path:
support-collector profile --jdkhome /path/to/java-jdk
How are applications, flows, and thread pools identified?
The tool uses the naming conventions for Mule 3 and Mule 4 for threads names to identify these values:
APPLICATION
FLOW NAME
THREAD POOL NAME
Mule 4
[MuleRuntime].cpuLight.03: [aaa-performance-issues].high_cpu_consumptionFlow.CPU_LITE @6a58fcd0
Mule 3
[aaa-performance-issues-mule3].consume_conns.stage1.01
NOTE: This parsing is indicative to ease the analysis.